Bacteriophage T4 Infection
JCVI-syn3A Minimal Cell
Insulin Release
HIV Vaccine
Caulobacter Polar Microdomain
HIV-Infected Cell
Collagen and Extracellular Matrix
Escherichia coli Bacterium
Myoglobin in a Whale Muscle Cell
Cellulose Synthase
CytoSkeleton
Transfer RNA and Gag Protein
RecA and DNA
Casein Micelle and Fat Globule in Milk
Model of a Mycoplasma Cell
Phage-based COVID-19 Vaccine
Myelin
Immunological Synapse
SARS-CoV-2 Fusion
Red Blood Cell Cytoskeleton
SARS-CoV-2 and Neutralizing Antibodies
Respiratory Droplet
Coronavirus
SARS-CoV-2 mRNA Vaccine
Coronavirus Life Cycle
Influenza Vaccine
Measles Virus Proteins
Lipid Droplets
Poliovirus Neutralization
Excitatory and Inhibitory Synapses
Abiogenesis
Last Universal Common Ancestor
Zika Virus
Insulin Action
Ebola Virus
Mycoplasma mycoides
Chloroplast
Autophagy
Vascular Endothelial Growth Factor (VegF) Signaling
Biosites: Muscle
Biosites: Basement Membrane
Biosites: Red Blood Cell
Biosites: Nucleus
Biosites: Blood Plasma
Biosites: Cytoplasm
Blood
Escherichia coli
HIV in Blood Plasma

Molecular Landscapes by David S. Goodsell

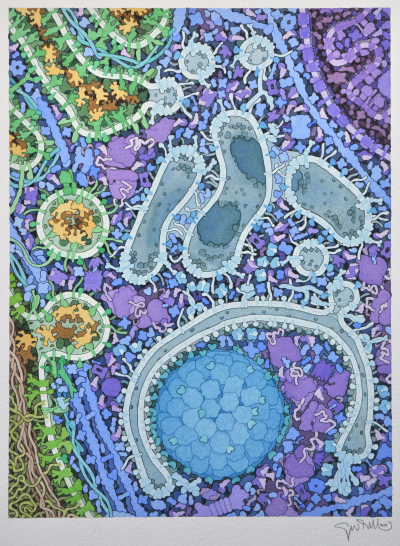
Autophagy, 2011

Acknowledgement: Illustration by David S. Goodsell and Daniel Klionsky. doi: 10.2210/rcsb_pdb/goodsell-gallery-012

The formation of an autophagosome is shown, with Golgi at top left, a mitochondrion at top right, and the autophagosome at bottom center. This illustration was created in collaboration with Daniel Klionsky at the University of Michigan as a cover for the journal Cell.

For more information, see the Molecule of the Month feature on Aminopeptidase 1 and Autophagy.